HIE-RO about to deliver an Indicator-based self-evaluation tool in Excel for public transport planners
By Marco Mazouzi
Within the task 4.2 “Implementing a multi-stakeholder planning model for public transport services “ HIE-RO is about to deliver an Indicator-based self-evaluation tool in Excel for public transport planners. This tool will assess the current public transport performance based upon selected key transport indicators, by monitoring the indicator performance over time as well as by comparing the city with other cities and regions. The tool will also indicate the strengths and weaknesses of the transport system of the city, thereby helping decision makers to identify fields of intervention in the public transport domain.
The main objective of the tool is the development of an easy-to-use self-evaluation (or monitoring) indicator tool in Excel that can be used by public transport planners to evaluate the performance of the local and regional (public) transport system. The tool will comprise all INTERCONNECT case study cities/regions (see above), and, in order to allow for comparisons with other cities, a number of selected other cities in the Baltic Sea region. The tool will provide the following functionalities:
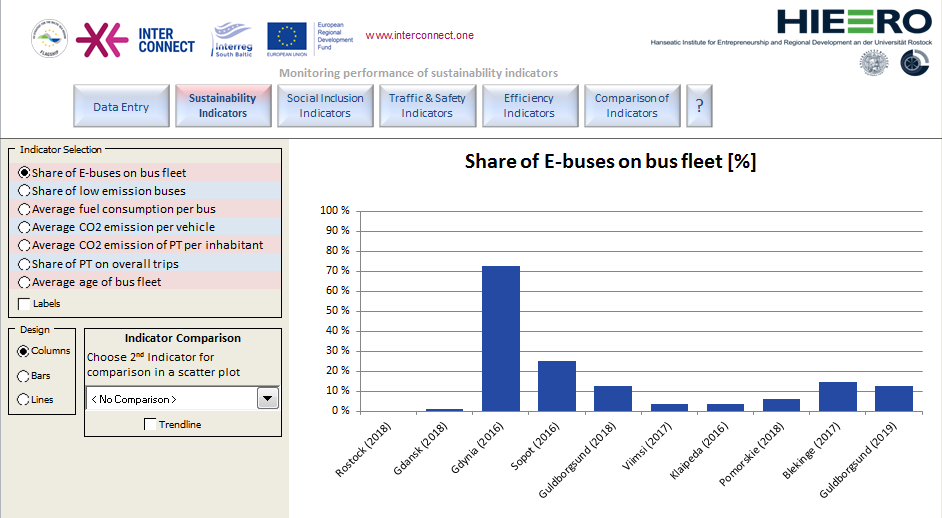
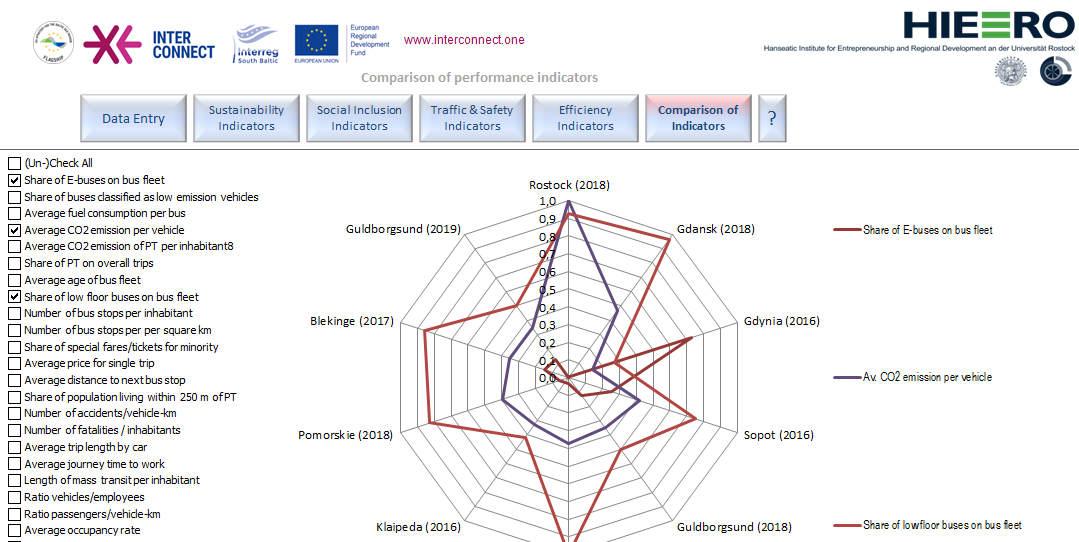
- Comparison: Compare the performance of the transport system on the basis of selected key public transport indicators over time, and compare them across cities and regions. Comparisons should be done in tabular form as well as in form of diagrams. The user shall be able to select the indicator he is interested in, as well as the cities or regions to compare with.
- Intervention fields: The tool will also aggregate indicator performance to intervention fields. Intervention fields might be sustainability, social inclusion, traffic and safety, efficiency and others. For each field of intervention, the tool will comprise approx. five key performance indicators.
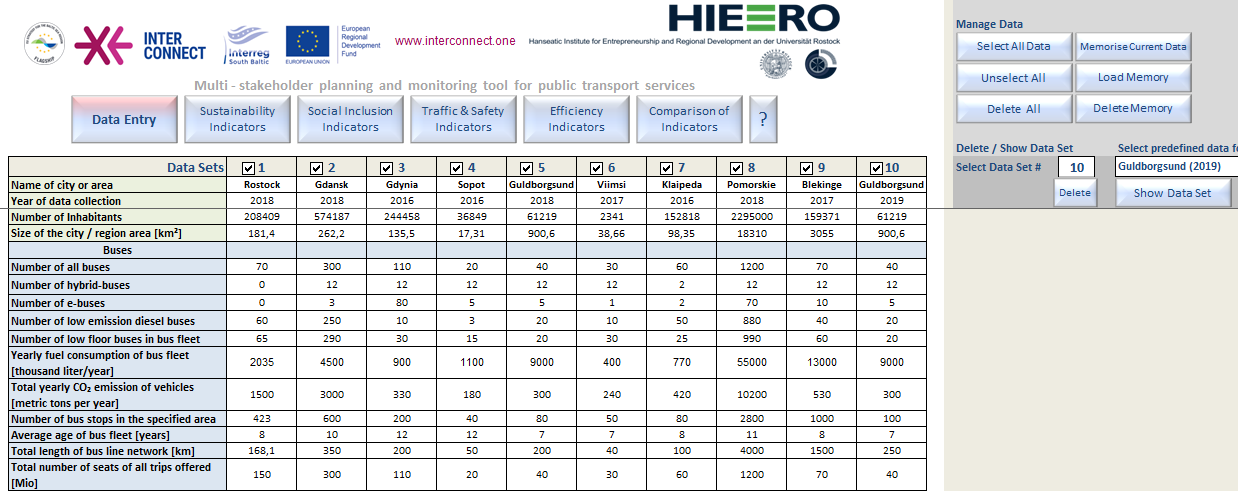
- Upload mask: Provide an upload mask allowing the user to enter new or update existing relevant data for his city in a convenient way, and options to add new cities. The idea being that each user will enter the relevant data/indicators for his city. Data for selected comparison cities, however, will be compiled as part of this assignment.
- Print and Export: Print and export tables and diagrams, so that comparison results can be copied into and used in other documents and software environments.
Below you will find some "dummy data" screen shots just to show how the tool works.